Emergentally.
Data-driven development for emerging economies
Development Dashboard
The world's simplest, most powerful development management solution
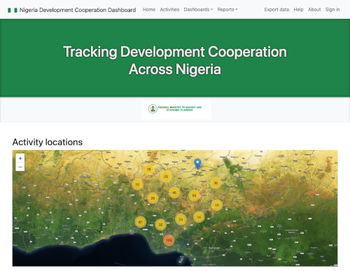
Originally working with Liberia's Ministry of Finance and Development Planning, we developed the Liberia Project Dashboard, an innovative system which transforms the management of aid and public investment management in the country. The system is now also used by Nigeria's Federal Ministry of Budget and Economic Planning.
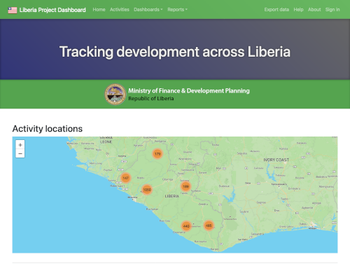
The Dashboard is currently the only system in the world which automatically updates financial data from donors – significantly increasing data quality and the sustainability of the system. It's lightweight and user friendly, but has a wide range of features to meet the needs of emerging economies.
Developed with civil servants and policy-makers
A fast and user-friendly interface helps civil servants keep data up to date, providing the information and insights which senior policy-makers need to make informed decisions.
Integrated with PFM processes
Financial data for government-funded projects can be updated by uploading data from IFMIS. Data can be exported in the format needed for the budget process. We're working towards making the data useful for debt management.
Monitoring and improving project performance
Advanced features allow a wide variety of results information to be captured in the Dashboard. Projects with low disbursement rates can be highlighted to indicate which projects need attention to improve performance.
Automatically updating financial data
For donor-financed projects, the world's most advanced IATI integration makes it possible to keep financial data up to date automatically, substantially improving data quality and reducing the burden of data collection.
Additional features
- IFMIS Integration: upload data from IFMIS, and download data in the format required for the budget process
- Counterpart funding: capture government counterpart funding commitments
- Results (outputs, outcomes and impact indicators): data collection and visualisation
- Dashboards: collect and visualise data according to funder, location (e.g. state or county), and any national classifications (e.g. sector, aligned ministry/agency, national development plan pillar)
- Reports: visualise project performance, disbursement rates, and counterpart funding
- Excel export: export all data in Excel format, for summary analysis, or analysis in a pivot table.
- Excel import: import data using Excel spreadsheet templates.
Free demonstration – with data for your country
Get in touch with us to arrange a free demonstration. If you wish, we can show you how the Dashboard would look using data for your country.
Book a free demonstration »